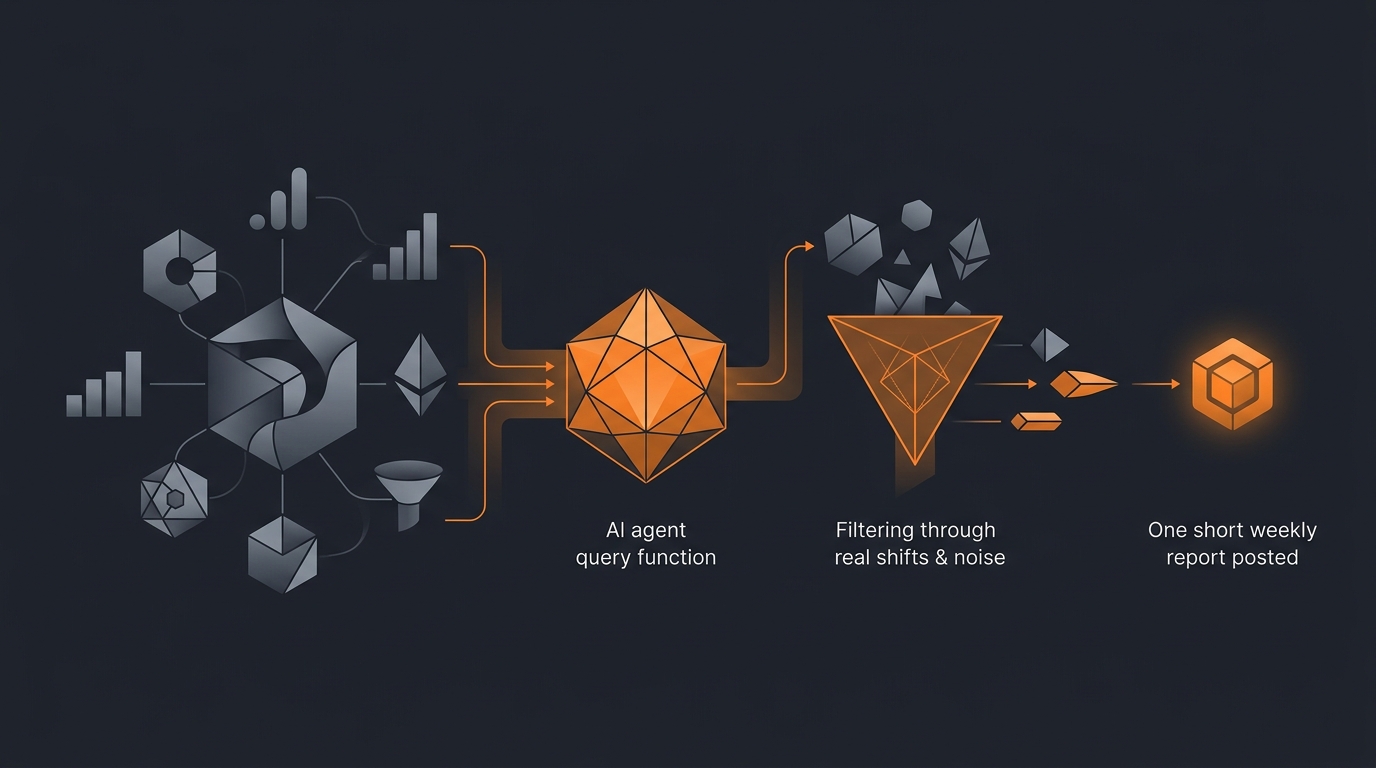
What this agent does
Most teams ignore Google Analytics until something is on fire. By the time something is on fire, the analytics signal has been visible for two or three weeks and nobody looked. A weekly summary agent removes the excuse: every Monday morning, a short report lands in one place, with the three or four numbers that actually shifted last week and an inline link to the GA4 report for each.
The agent does not generate insights about your business. It surfaces statistical shifts. Insights are a human's job.
For broader context, see what an AI agent can actually do. For the cluster of "agent reads X, summarises X," see AI agent for Notion daily rollup and AI agent for Linear sprint summary.
GA4 API access
The Google Analytics Data API (v1, the GA4 API; not the legacy Universal Analytics Reporting API which was sunset) requires a Google Cloud project with the API enabled and a credentialed service account.
- Service account. Created in Google Cloud. The service account's email is added to the GA4 property as a Viewer. Viewer is the minimum role that can query data.
- API scope.
https://www.googleapis.com/auth/analytics.readonly. Read-only. The agent has no business modifying properties or events. - Quotas. GA4 Data API is governed by per-project and per-property quotas, documented by Google as concurrent requests, daily tokens, and per-hour tokens. A weekly summary is a small handful of queries; the quotas are not a concern at this scale.
- Sampling. GA4's standard properties may sample for high-cardinality queries. For most weekly summaries on small to mid sites this is not an issue; for high-traffic sites where sampling matters, the agent uses date ranges and dimension filters that keep responses unsampled.
The fixed metric set
Pick eight. Maintain the list. Resist additions.
- Sessions. Total visit count.
- Engaged sessions. Sessions that triggered a conversion event or lasted 10+ seconds. The honest GA4 successor to "non-bounce."
- Engagement rate. Engaged sessions over total sessions.
- Conversions. Configured conversion events fired.
- Conversion rate. Conversions over sessions.
- Average engagement time. Per session.
- Top landing pages. Top five, with sessions each.
- Top source/medium. Top five, with sessions each.
The metric set is not customer revenue, profit, or churn. Those live in different systems and the agent should not pretend to know them. GA4 is for what GA4 measures.
Statistical significance vs noise
Week-over-week comparisons are noisy. A single bad Monday or a holiday in the comparison week can move every metric by 20% with no actual underlying change.
The agent uses a four-week rolling baseline. For each metric, it computes the mean and standard deviation across the four prior complete weeks. The current week is expressed as a z-score against this baseline. A z-score with absolute value above 2.0 is "flagged"; below that, it is "noise" and the agent does not surface it.
This is not academically rigorous (the underlying distribution is not normal, autocorrelation is real, etc.) but it is honest about noise in a way that bare percentage comparisons are not. The agent labels every flagged shift with its z-score so the reader can judge severity.
Summary format
The output is short by design. 300 to 500 words. Three sections.
- Headline. One sentence: "Sessions up 18% (z=2.3); conversion rate stable; engagement time down 12% (z=-2.1). Notable shift: organic traffic to the pricing page accounts for most of the sessions gain."
- Flagged metrics. For each metric with |z| > 2.0, a one-line entry with the current value, the four-week baseline, the z-score, and a link to the GA4 Explore report for that metric. No interpretation in the line itself.
- Correlated dimensions. For each flagged metric, the top dimension that correlates with the shift. "Sessions gain correlated with source=google, medium=organic, landing page=/pricing." This is the only place the agent shows breakdowns. It is descriptive, not causal.
No charts in the summary. GA4 has charts. The summary is words, with links.
Guardrails
Five guardrails on a data-summary agent.
- Read-only access. Service account stays at Viewer.
- No PII surfacing. The agent does not query user-level dimensions or anything that could identify individual visitors. Aggregates only.
- Configurable threshold. The z-score threshold is operator-settable. Smaller teams might prefer 1.5; larger teams 2.5.
- No automatic re-run during incidents. If GA4 reports a property processing delay (which Google publishes via API), the agent posts a "data delayed, summary skipped this week" notice instead of running on incomplete data.
- Single destination. The agent posts to one place. Multi-destination fan-out fragments the conversation.
Common mistakes
Reporting every metric. GA4 exposes hundreds. Reporting 30 of them weekly is the fastest way to ensure none of them are read. Eight is the right number.
Skipping the baseline. Week-over-week percentage comparisons feel concrete and are mostly noise. A four-week baseline plus z-scores is the small extra effort that makes the report credible.
Generating "insights" with the LLM. Letting the underlying model speculate on causes ("conversions probably rose because of your new content") is the fastest way to undermine trust. The agent reports adjacencies, not causes.
Running on sampled data without disclosure. If GA4 sampled a query, the agent should label the line with "(sampled)" and link to the property settings for upgrading to unsampled reports.
Mixing GA4 with Search Console without labelling. Search Console clicks and GA4 organic sessions are not the same number and they will not agree. Don't quietly blend them.
Sending the report at the wrong hour. Monday morning is the right slot for a US-headquartered team. For a team in Asia/Calcutta the right slot is Monday late-morning IST so the report lands when people are at their desks, not at 3am after a UTC cron fired. Time-of-day looks trivial until reports go unread for six weeks because they always arrive overnight.
Reporting against the wrong baseline window. Four weeks is the right baseline for most businesses, but a business with strong weekly seasonality (B2C ecommerce around weekends, B2B drops around payday cycles) needs a baseline that accounts for it. The agent's z-score should compare against the same day-of-week across baseline weeks, not against the raw 28-day mean. This is one configuration line; getting it wrong turns every Monday report into an alarm about Sunday's traffic dip.
Skipping the "nothing notable this week" report. When no metric crosses the threshold, the agent should still post a short note. "Nothing notable this week. All eight metrics within one standard deviation of the four-week baseline." Silence in the channel makes the team wonder if the agent broke. A boring report is itself a signal.
Frequently asked questions
What does a GA4 weekly summary agent actually do?
It queries the Google Analytics Data API for a defined set of metrics, compares the most recent week to the prior four-week baseline, flags shifts that exceed a statistical threshold, and posts a single concise summary to one destination. It does not change site configuration, modify events, or interpret causes. It points the human at the shifts that matter.
Which Google Analytics permissions does the agent need?
A service account credentialed with at least Viewer access on the GA4 property, plus the Google Analytics Data API enabled in the Google Cloud project. The service account never receives Edit or Admin permissions; the agent's job is read-only by design. Refresh tokens are stored in a secrets manager and rotated every 90 days.
How does the agent decide a shift is significant?
It computes the mean and standard deviation of each metric over the prior four weeks, then compares the current week's value as a z-score. A z-score above 2.0 (or below -2.0) is flagged. Direction matters: a 2.5 standard-deviation rise in bounce rate is bad; a 2.5 rise in conversions is good. Both get flagged with the right framing.
Does the agent diagnose causes?
Lightly, never confidently. The agent reports correlated dimensions when a metric shifts (source/medium, landing page, country). It does not assert causation. 'Conversions up 30% week-over-week. The shift correlates with traffic from organic search to the pricing page.' That is the limit. The marketer or the analyst owns the causal claim.
Where does the summary get posted?
One configured destination: a Slack channel, an email to a distribution list, or a Notion page under an analytics parent. Default is a Notion page named with the ISO week. The summary is short (300 to 500 words) and includes inline links to the GA4 Explore reports for each flagged metric so the reader can dig deeper in one click.
Three takeaways before you close this tab
- Eight metrics, no more. Discipline beats coverage.
- Z-score over percentage. Noise has to be priced in.
- Adjacency, not cause. The agent points; the human concludes.
Sources
- Google Developers, "Google Analytics Data API (GA4) reference", retrieved 2026-05-11, developers.google.com/analytics/data/v1
- Google Developers, "Data API quotas and limits", retrieved 2026-05-11, developers.google.com/analytics/data/quotas
- Google Analytics Help, "About sampling in GA4 reports", retrieved 2026-05-11, support.google.com/analytics/13331292
- NIST, "SP 800-53 AC-6 Least Privilege", retrieved 2026-05-11, csrc.nist.gov/sp800-53/AC-6
- Gravity team, "Gravity analytics-agent guardrails", internal v1, May 2026, About
Related agent patterns
The same shape, applied to other tools and surfaces:
- AI agent for Linear sprint summary, weekly rollups for engineering work.
- AI agent for Notion daily rollup, the daily-cadence companion.
- AI agent for weekly KPI reports, the broader KPI rollup pattern.
- AI agent for competitor tracking, another monitoring-and-summarising agent.
- AI agent safety and guardrails, the principles every monitoring agent respects.
- AI agent tool use explained, how an agent gets credentialed against the GA4 API.
- How we test AI agents with 80 tests per capability, the calibration methodology.